This repository contains a Python script that generates Fibonacci numbers, selects a random subset of them, computes the Fast Fourier Transform (FFT) on the data, and visualizes the results through scatter plots. The visualizations include both the original data and its frequency domain representation.
The script requires the following Python libraries:
numpypandasmatplotlibscipyInstall the required dependencies using pip:
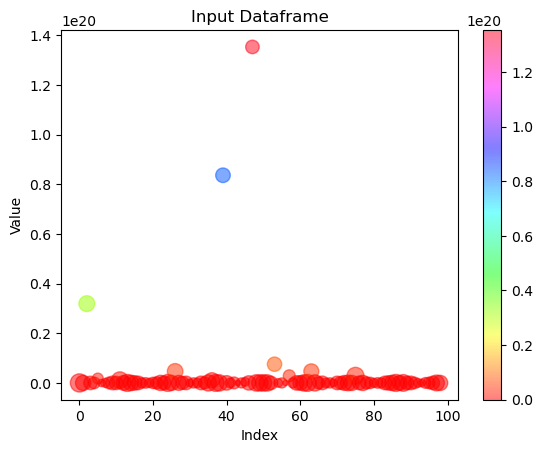
pip install numpy pandas matplotlib scipygit clone https://github.com/your-username/fibonacci-fft-visualization.gitcd fibonacci-fft-visualizationpython fibonacci_fft_visualization.pyScatter Plot 1: Shows the original Fibonacci numbers, with the x-axis representing the index and the y-axis representing the value.
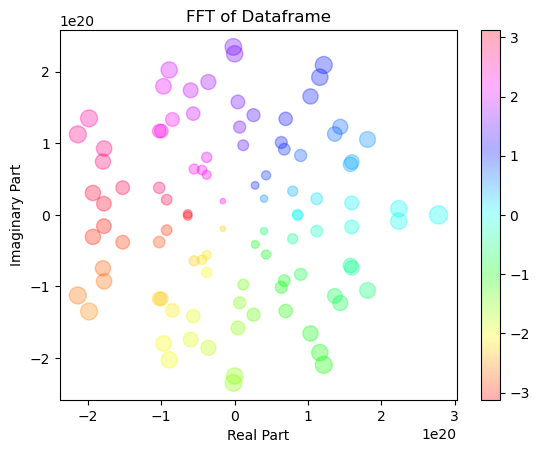
Scatter Plot 2: Displays the real vs. imaginary parts of the FFT, with colors representing the phase.
This project is licensed under the MIT License - see the LICENSE file for details.
Feel free to fork this repository, open issues, and submit pull requests if you'd like to contribute to this project.